
Separation processes
In the chemical and biotechnological industry one of the most important steps is the purification of desired products. It is not only critical for purity but for costs. Interest components are generally mixed in a single phase, then the main strategy is to take them to different phases by taking advantage of their characteristic properties.
The following phases may be present:
-
Gas - Liquid
-
Solid - Liquid
-
Gas - Solid
-
Liquid - Liquid (inmiscible)
First some concepts: Raoult's Law and T-x-y / P-x-y Diagrams
To understand how separation processes are designed we have to fully understand the ideal cases. For this we need Raoult's Law, which helps us obtain T-x-y and P-x-y Diagrams that are necessary for design.
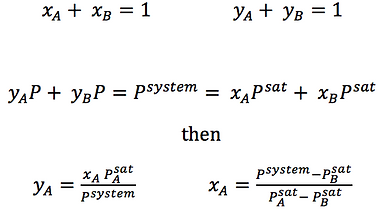
From Raoult's Law , Henry's Law and our knowledge of vapour - liquid equilibrium we know that (you may review the derivation on our pdf document) :
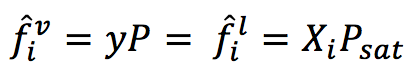
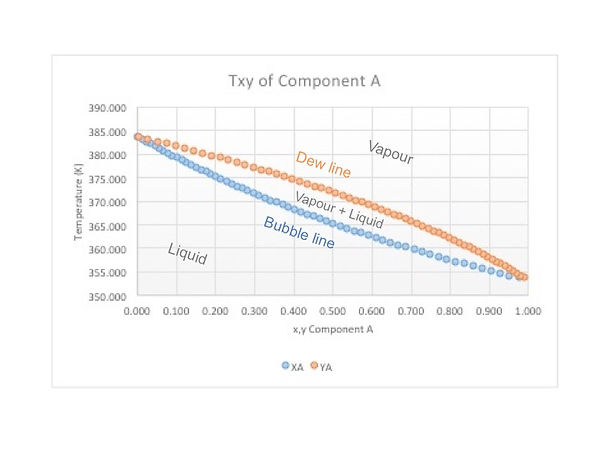
From the previous statement Txy and Pxy diagrams are built. The zone over the Y line (dew line) is the vapour zone, the envelope or region formed between both lines is the vapour - liquid zone and under the X line (bubble line) it is liquid. Note that only one component is graphed, but it is based on a binary interaction. For a T-x-y diagram pressure is fixed, so if you change the pressure the diagram changes!
Remember that x is the mole fraction in the liquid phase and y is the mole fraction in the vapour phase.
P-x-y diagrams change slightly. Here the same principle applies: temperature is fixed and each diagram is temperature - specific. They look like this:
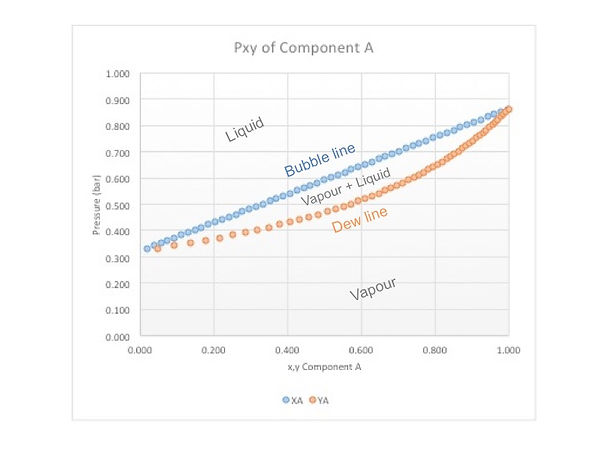
These diagrams allow us to know the mole fraction of component A in the liquid and vapour phases when it is in equilibrium in a binary mixture. To do so, choose a desired temperature or pressure and move horizontally along an isothermal or isobaric line until you cross both lines. The points will give you the mole fractions for each phase.
Txy and Pxy Diagram Construction
To generate a Txy or Pxy diagram we need to know first how Antoine's Law is defined:
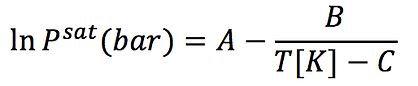
Where A, B and C are Antoine's parameters specific for each molecule.
To generate a Txy diagram in a programme such as Microsoft Excel you need to build the following table. Make sure to place the most volatile component as A. Fill the temperature column by choosing an interval (say 0.5 K) and generating the different points until you reach the second saturation temperature. The pressure columns are filled by obtaining P from Antoine's Law.
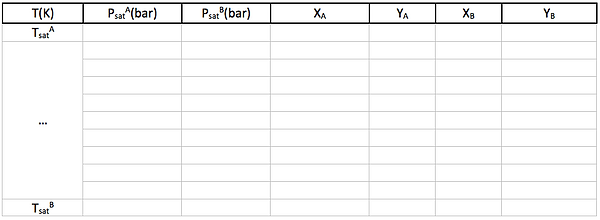
To generate the remaining columns you need to take into account the following:
On this Excel file you may review how the Txy diagram was finally done, including how the Pxy is created with the same formulas but with some different considerations.
As an engineer at some time you will have to use specialized software, like Aspen. Therefore we provide you with a tutorial for making Txy, Pxy and basic simulations on Aspen V8.6. We hope that you are able to put it into practice at your university. (Click on the top-right arrows)
Or you can download it on PDF here:
Flash tanks and the Lever Rule
The Lever Rule Derivation
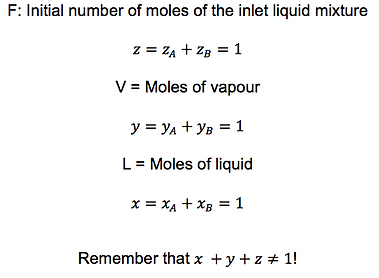
Suppose a flash tank with one inlet stream (F) made up of a binary liquid mixture. This mixture is separated on two streams: one of vapour (V) and one of liquid (L) following equilibrium.
First of all, remember the following basics, where z, y and x represent the molar fractions of each phase:
Now establish a general and a particular mass balance, where some alegra is done as follows:
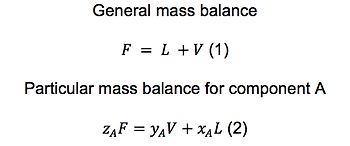
and by solving for yA on (2) and V on (1) you will be able to mix both equations. After this only some algebra is needed to obtain the lever rule:
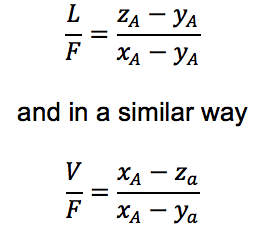
Now, you may wonder, how can I visually understand the Lever Rule?
For this we need either a Txy or Pxy diagram. We’ll work with the Txy. First, notice that there are four points labeled on the graph: A, C, D and E. The line C-E joins a x and y values at a specific temperature. On the other hand, D-A determines a specific point in C-E to a mol fraction value A.

So what is the point of knowing the positions of A, C, D and E? Simple, the Lever Rule won’t tell you the molar fractions for a specific temperature, because you should be able to calculate them. Instead, the rule lets you quantify how much of your stream will go to vapour and remain in the liquid. Analyse both of the equations, they provide ratios of the outlet streams to the inlet that depend only on molar fractions. The calculated ratio applies to any inlet flow, no matter if it is 1 mol/s or 1 kmol/s.
The lines on the graph represent the following:
C-E: inlet stream F
C-D: the fraction of F that goes to the vapour phase
D-E: the fraction of F that remains in the liquid phase
Common doubt: Why is C-D vapour and D-E liquid when both are located on the V + L region? C-D is vapour because it directly touches the dew line. After this point, the phase must be vapour, otherwise no phase change would have occured. The same principle applies for the D - E line.
Note: to quantify the vapour and liquid streams you may also solve the mass balances defined on (1) and (2).
To review the bencene - toluene exercise with the use of the lever rule, open the next presentation:
Real cases
Up to this moment only ideal diagrams have been analysed. Mixtures do not behave (generally) in an ideal way, that is the reason for the development of so many different models. Intermolecular interactions and several other factors are the responsible for the deviation from ideality. Here are some non-ideal diagrams produced on Aspen Plus V8.6.
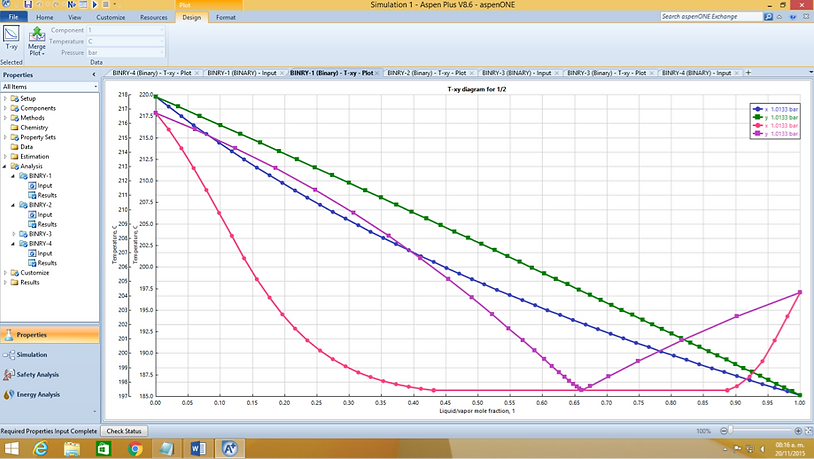
NRTL vs Ideal of an ethyleneglicol - naphthalene mixture
Real mixtures may produce a point called azeotrope, where the liquid and vapour composition are the same. Ethyleneglicol - naphthalene produce a clear azeotrope that will prevent any further purification when it is reached. Each mixture is unique and needs to be studied individually no determine the best simulation method.